How to Debug a Website on Safari on iOS
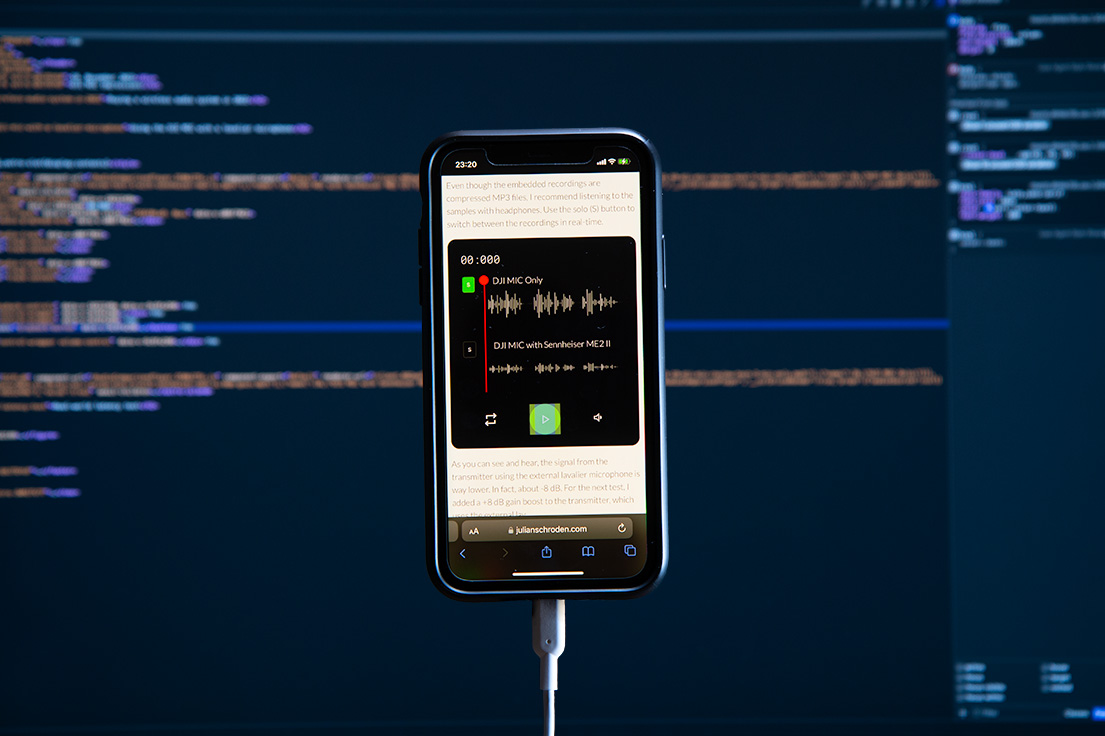
When I was working on the audio player for the DJI MIC Review, I tested the implementation on Safari on iOS just before publishing the post, only to realize the scrubbing behavior was buggy. But how to debug a website on a mobile browser, which doesn’t come with any dev tools?
In this article, I describe how to debug a website on Safari on iOS using a connected MacBook and the Web Inspector feature. I use an iPhone 11 running iOS 16.1 and a MacBook Pro running macOS Monterey 12.6.
Step 1: Enabling the Web Inspector option on the iPhone
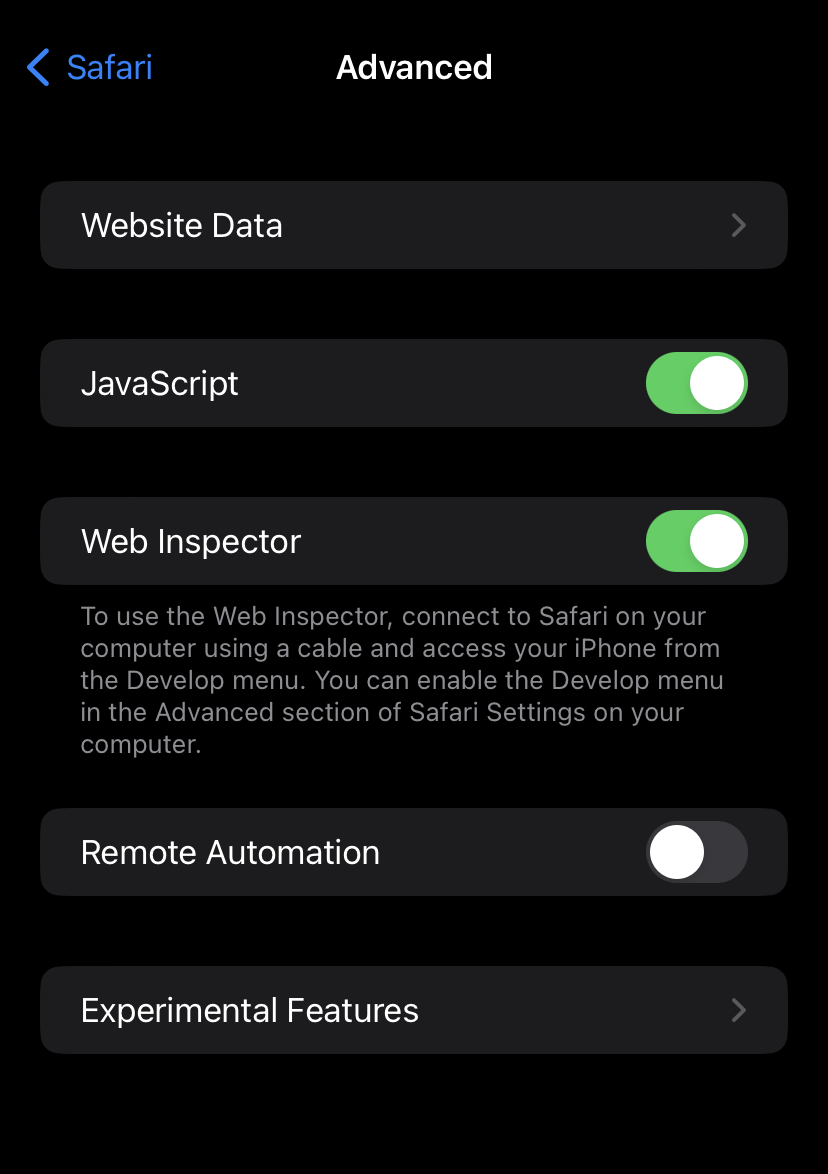
Open the settings app and navigate to the Safari entry. Within the Safari settings, scroll to the very bottom and open the Advanced options. Here you can find a toggle to enable the Web Inspector feature.

Step 2: Enabling the Developer Mode on Safari on Mac
Start Safari on the Mac and open the Preferences (Safari > Preferences). In the “Advanced” tab, enable the “Show Develop menu in menu bar” option.

Step 3: Connect your iPhone and start debugging
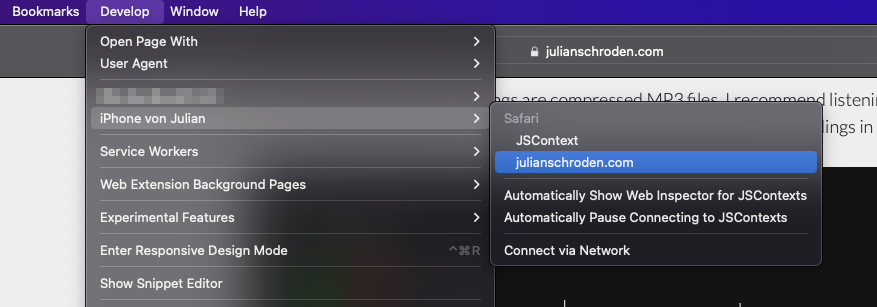
Launch the mobile Safari App and connect the phone to your Mac using a USB cable. Your device should be listed within the Develop menu, where you can select the currently active tab to launch the dev tools.

And that was about it. Now you can use the full power of the dev tools and poke around in the HTML, look at the console output, or track down network requests.
